An Introduction to Standard Deviation: Explanation, Steps, & Calculations
In statistics, two major concepts are used to explain the dispersion of given data points are said to be standard deviation and variance. Both concepts play a vital role in various fields of education and daily life to interpret and analyze data.
The deeper introduction of standard deviation will be discussed in this article, we are going to explain the concepts of standard deviation along with its definition, types, steps, and calculations.
What is the term Standard Deviation in Statistics?
In statistics, a measure that computes the amount of dispersion in a set of sample or population data is known as standard deviation. The standard deviation can also be defined as the square root of the result of variance.
This statistical measure shows the usual distance between each term of the sample or population data set and the mean of the given set. The value of the standard deviation could be lower and higher on the basis of a set of values.
- A higher value of STD shows a larger dispersion (far from the mean as values are more spread out) in a data set of sample and population.
- A lower value of STD shows a smaller dispersion (closer to the mean as values are less spread out) in a data set of sample and population.
Types of Standard Deviation
There are two types of STDs that are commonly used in statistics. Such as:
Population Standard Deviation
In statistics, the term population standard deviation is a kind of STD that deals with the data of an entire population. The dispersion of the values from the average is based on the whole set of data values.
The formula of the population STD includes the quotient of the sum of squared differences and the number of data points, and taking the square root of the result. It is denoted by σ. The mathematical formula is:
| σ = √Σ (xi – μ)2 / N | σ = represents the population STD μ = represents the population mean xi = represents population data points N = represents the total number of values |
Sample Standard Deviation
In statistics, the term sample standard deviation is a kind of STD that deals with the subset of an entire population. The dispersion of the values from the average is based on the subset of the whole set of data values.
The formula of the sample STD includes the quotient of the sum of squared differences and the number of data points minus one, and taking the square root of the result. It is denoted by s. The mathematical formula is:
| s = √Σ (xi – x̄)2 / N – 1 | s = represents the sample STD x̄ = represents the sample mean xi = represents sample data points N = represents the total number of values |
How to calculate the problems of finding Standard Deviation?
Follow the below steps to understand how to calculate the standard deviation.
Calculate the Mean
First of all, collect the sample or population data set and evaluate the sample mean or population mean by taking the quotient of the sum of values and total numbers. Σxi/N
Calculate the difference between data points from the mean
After that take the difference of each data point of sample or population data from the calculated mean. i.e., xi – x̄ or xi – μ
Calculate the sum of squared differences
After taking the differences, take the square of each term (xi – x̄)2 or (xi – μ)2. Then find the sum of squared differences Σ (xi – x̄)2 or Σ (xi – μ)2.
Divide the step 3 by the total observations
Now find the quotient of the sum of squared differences and the total number of observations.
- For sample STD: Σ (xi – x̄)2 / n – 1
- For population STD: Σ (xi – μ)2 / N
Take the square root
Take the square root of the result of the quotient of the sum of squared differences and the total numbers.
- For sample STD: √ [Σ (xi – x̄)2 / n – 1]
- For population STD: √ [Σ (xi – μ)2 / N]
Now let us take a few examples to understand precisely.
Example 1: For Sample STD
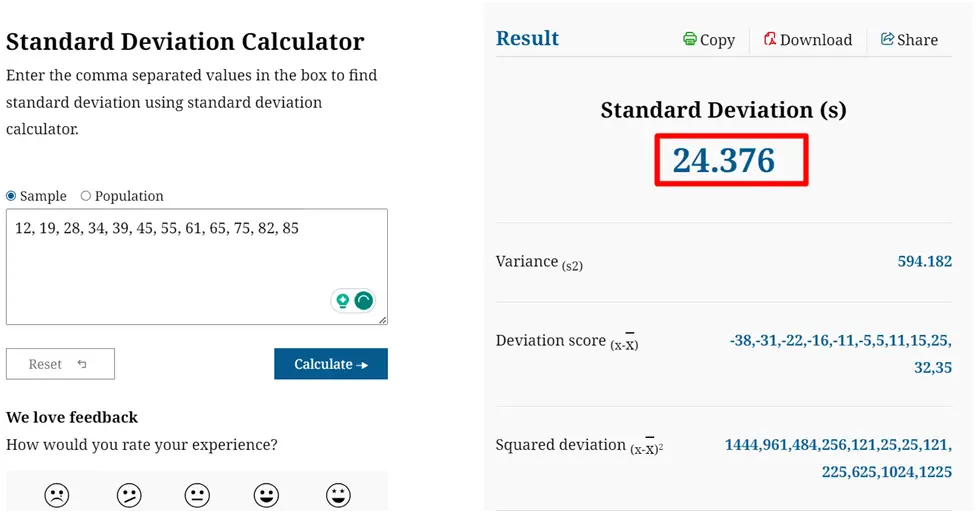
Calculate the standard deviation of the monthly target data of 12 employees out of 50 of an IT company for the past month, given the target points [12, 19, 28, 34, 39, 45, 55, 61, 65, 75, 82, 85].
Solution
Step 1: Find the expected value of the monthly achievements of targets of employees.
Monthly achievements = 12, 19, 28, 34, 39, 45, 55, 61, 65, 75, 82, 85
Expected value of monthly achievements = [12 + 19 + 28 + 34 + 39 + 45 + 55 + 61 + 65 + 75 + 82 + 85] / 12
Expected value of monthly achievements = 600/12
Expected value of monthly achievements = 50
Step 2: Calculate the difference between each monthly achievement from the expected value
Difference = xi – x̄
xi – x̄ = [12 – 50, 19 – 50, 28 – 50, 34 – 50, 39 – 50, 45 – 50, 55 – 50, 61 – 50, 65 – 50, 75 – 50, 82 – 50, 85 – 50]
xi – x̄ = [-38, -31, -22, -16, -11, -5, 5, 11, 15, 25, 32, 35]
Step 3: Now take the square of each difference and then calculate the sum of squared differences.
Square of Differences = (xi – x̄)2
(xi – x̄)2 = [(-38)2, (-31)2, (-22)2, (-16)2, (-11)2, (-5)2, (5)2, (11)2, (15)2, (25)2, (32)2, (35)2]
(xi – x̄)2 = [1444, 961, 484, 256, 121, 25, 25, 121, 225, 625, 1024, 1225]
Summation of squared differences = ∑(xi – x̄)2
∑(xi – x̄)2 = [1444 + 961 + 484 + 256 + 121 + 25 + 25 + 121 + 225 + 625 + 1024 + 1225]
∑(xi – x̄)2 = 6536
Step 4: Now divide the above summation of squared differences by the total observations minus one.
∑(xi – x̄)2 / n – 1 = 6536 / 12 – 1
∑(xi – x̄)2 / n – 1 = 6536 / 11
∑(xi – x̄)2 / n – 1 = 594.1818
Step 5: To compute the STD, take the square root of the above result.
√ [Σ (xi – x̄)2 / n – 1] = √594.1818
Std = s = 24.38
A sample standard deviation calculator can also be used to deal with the subset of population data values in order to get quicker results.
Example 2: For Population STD
Calculate the population Standard deviation of the given data [14, 15, 16, 23, 33, 44, 48, 57, 65, 73, 74, 79, 80, 93].
Solution
Step 1: Find the average value of the given population set of data.
Mean of Population STD = [14 + 15 + 16 + 23 + 33 + 44 + 48 + 57 + 65 + 73 + 74 + 79 + 80 + 93] /14
Mean of Population STD = 714/14
Mean of Population STD = 51
Step 2: Calculate the difference of each data value from the expected value.
| Xi | Xi – μ |
| 14 | 14 – 51 = -37 |
| 15 | 15 – 51 = -36 |
| 16 | 16 – 51 = -35 |
| 23 | 23 – 51 = -28 |
| 33 | 33 – 51 = -18 |
| 44 | 44 – 51 = -7 |
| 48 | 48 – 51 = -3 |
| 57 | 57 – 51 = 6 |
| 65 | 65 – 51 = 14 |
| 73 | 73 – 51 = 22 |
| 74 | 74 – 51 = 23 |
| 79 | 79 – 51 = 28 |
| 80 | 80 – 51 = 29 |
| 93 | 93 – 51 = 42 |
Step 3: Now take the square of each deviation.
| (Xi – μ)2 |
| (-37)2 = 1369 |
| (-36)2 = 1296 |
| (-35)2 = 1225 |
| (-28)2 = 784 |
| (-18)2 = 324 |
| (-7)2 = 49 |
| (-3)2 = 9 |
| (6)2 = 36 |
| (14)2 = 196 |
| (22)2 = 484 |
| (23)2 = 529 |
| (28)2 = 784 |
| (29)2 = 841 |
| (42)2 = 1764 |
Step 4: Now take the sum of the squared deviations.
Sum of Squared Deviation = [1369 + 1296 + 1225 + 784 + 324 + 49 + 9 + 36 + 196 + 484 + 529 + 784 + 841 + 1764]
∑ (Xi – μ)2 = 9690
Step 5: Now divide the sum of squared differences by the total numbers
∑ (Xi – μ)2 / N= 9690/14
∑ (Xi – μ)2 / N= 692.14
Step 6: To evaluate the standard deviation, take the square root of the average squared deviation.
√ [∑ (Xi – μ)2 / N]= √692.14
SD = σ = 26.31
Wrap Up
In this article, we’ve explained the term standard deviation along with its types, steps, and solved examples. The term standard deviation is a fundamental statistical measure that plays a vital role in measuring the dispersion in a data set.